
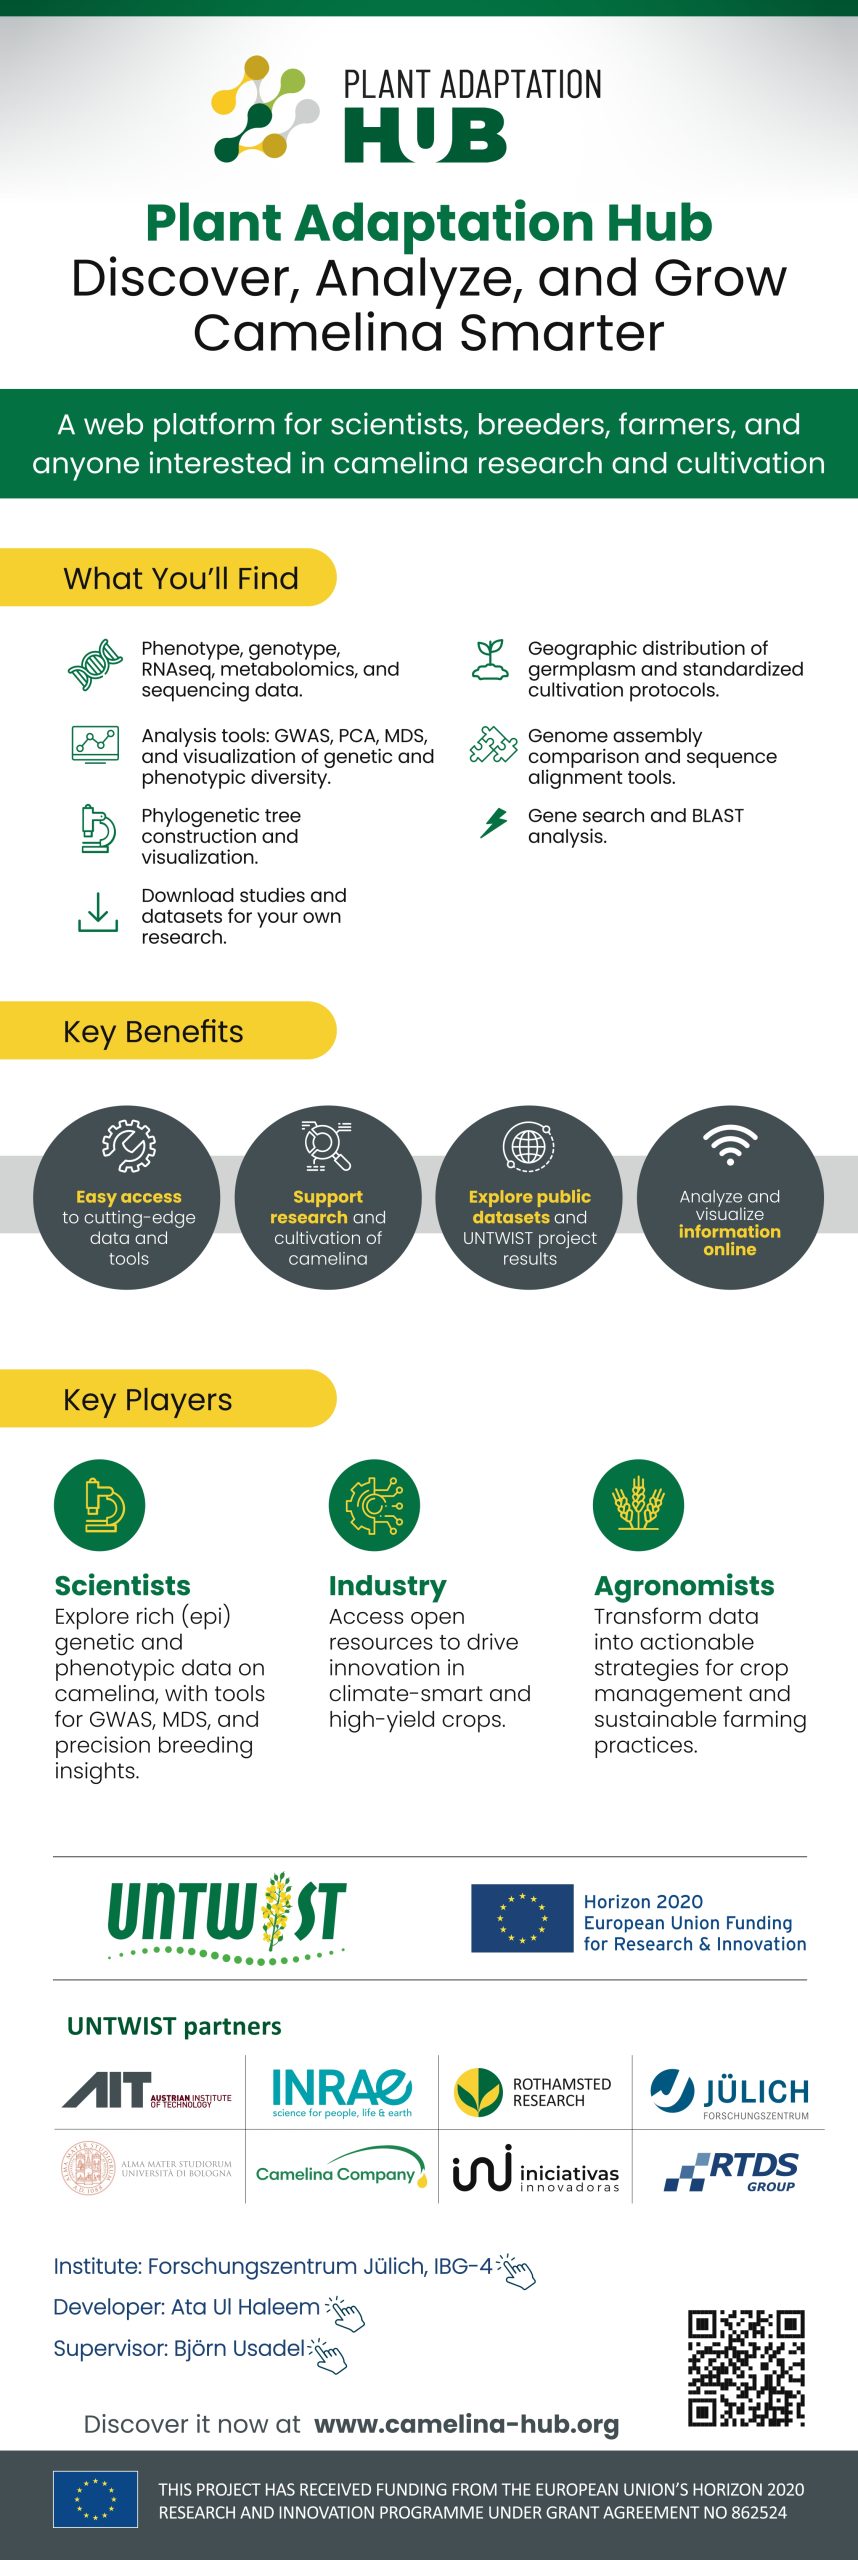

UNTWIST Knowledge Hub, has been created to translate and disseminate project discoveries into practical know-how for a wide range of stakeholders in agriculture.
The Knowledge Hub now provides access to (epi)genetic, metabolic, physiological, and agronomic data on camelina, along with tools for data exploitation, metabolic markers, and models for yield prediction.
All resources and models developed in UNTWIST are freely accessible through the Knowledge Hub, enabling a diverse community of users to benefit from these advances for precision breeding and climate-smart cropping.
The platform also includes a discussion forum, designed to enhance interaction and awareness among stakeholders—including breeders, farmers, industry, researchers, students, policymakers, and the general public—supporting the effective translation of research outcomes into real-world applications.
Throughout the project, UNTWIST has ensured appropriate sample identification, data management, and data tracking, establishing the computational foundations of the Knowledge Hub. The platform follows FAIR principles (“FAIR Guiding Principles for scientific data management and stewardship”), ensuring that digital assets are findable, accessible, interoperable, and reusable.
This unique Knowledge Hub represents an unprecedented ‘one-stop shop’ for the diverse user and stakeholder communities UNTWIST aims to support. Project-generated and publicly available data are now jointly presented, enabling users to generate insights and explore knowledge through interactive browsing and graphical analysis.
HOW CAN I EXPLORE THE PHENOTYPIC DATA?
The module, VisPheno, serves as a comprehensive repository for all collected phenotypic data acquired throughout the project lifecycle. Its primary objective is to furnish users with an in-depth understanding of the distribution of the targeted phenotype. This is accomplished through the utilization of various plot types.
For instance, to obtain a holistic view of the phenotype, users can generate a straightforward bar plot, providing a visual representation of raw phenotypic data across the entire population. Alternatively, users have the capability to summarize data by extracting key statistical metrics such as minimum, maximum, median, and quartiles, employing box plots to identify potential outliers.
Furthermore, users can conduct comparative analyses between different phenotypes by contrasting their distributions. This is facilitated by the utilization of violin plots and raincloud plots. In addition, the software empowers users to detect potential confounding factors through the implementation of linReg plots.
In addition to visualization capabilities, the component offers robust data filtering options, enabling users to construct intricate queries using mathematical and logical operators. Notably, the resulting plot dynamically adapts to reflect these changes, ensuring that users receive real-time feedback and insights.
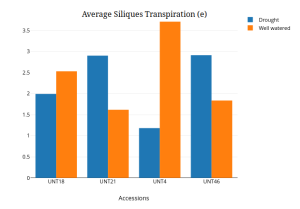
Photo credit: UNTWIST Plant Adaptation Hub
HOW DOES GWAS ANALYSIS IMPLEMENTED?
This component allows for the conducting GWAS analysis on any phenotypic or metabolic traits collected during the project. To this end, Plink, a C/C++ command line program for population genetics analysis is compiled to webassembly module which enables highly scalable in-browser GWAS analysis. This tool enables automated association testing for quantitative as well qualitative response variable using plink commands (–assoc, –qassoc) made available by plink webassembly module.
Additionally, fitting linear regression model implement in plink (–linear), this tool allows one to perform GWAS analysis accounting for population structure in the data using first two principle components (PC1 and PC2) as covariants, computed using the same genotypic data being used for GWAS analysis.
Following the GWAS analysis, our tool employs JavaScript to seamlessly manage the results. Multiple downstream analysis and visualization components operate in parallel, generating essential outputs, including Manhattan plots, QQ-plots, structural annotations, and functional gene annotations (mercator4.5) of the genome. This comprehensive suite of functionalities empowers researchers to explore and interpret GWAS results with precision and efficiency.
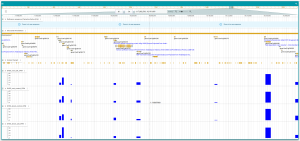
Photo credit: UNTWIST Plant Adaptation Hub
HOW THE UNTWIST APP PERFORMS MDS ANALYSIS?
The Multidimensional Scaling (MDS) analysis is seamlessly integrated into the Plink WebAssembly module, facilitating a streamlined workflow for this analytical task. To compute MDS coordinates, the tool is invoked using Plink with a set of specific flags.
The MDS analysis is initiated with the –read-genome, –cluster, –ppc, and –mds-plot flags. This calculates the first two coordinates of the MDS representation.
Subsequently, the resulting MDS data is seamlessly integrated with Plotly to create an illustrative MDS plot, offering a visually intuitive representation of the multidimensional relationships within the data.
This integrated approach provides users with a robust and insightful means of exploring multidimensional genetic data.
Furthermore, the resulting plot also shows the respective clusters colored differently based on genome-wide IBS.